Statistical modelling: Responses
Define your research question and identify your response variable (what variability are you trying to explain?)
Present the motivation for your research question (why is this question worth exploring?)
Describe the nature of your response variable
Explore your response variable observations
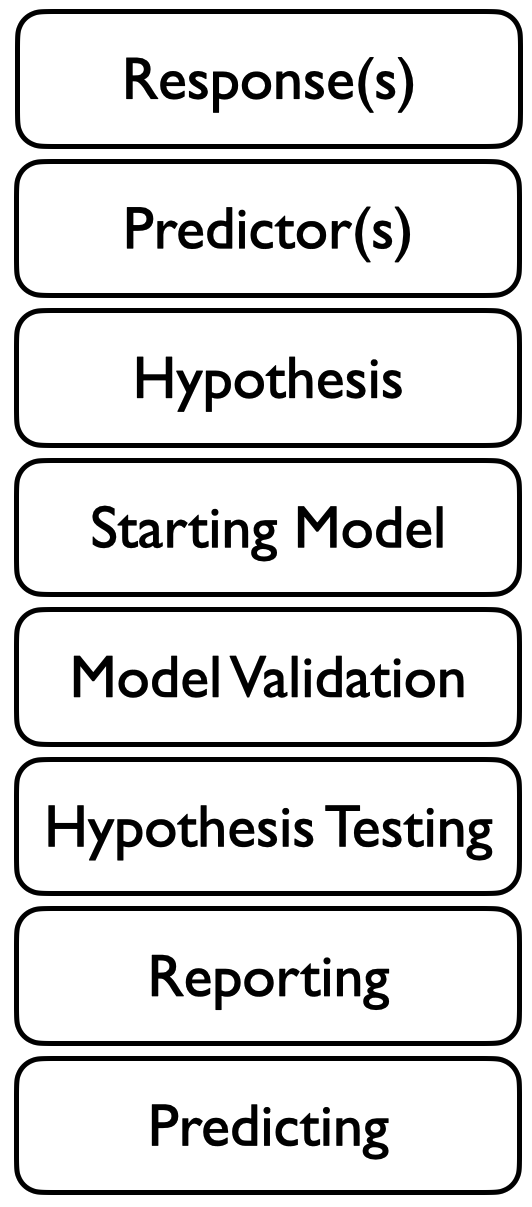
The first step of the statistical modelling framework is to identify your response variable1.
Your response variable is the observed variability you are trying to explain. As mentioned earlier, all science is explaining variability - why something you observe is changing. Your response variable is the “thing” you are trying to explain. It is sometimes called by other names such as “dependent variable” or “y variable”.
Before you can proceed with your hypothesis making and testing, you need to be clear about the variation you are trying to explain and how it was observed. What is making you curious?
“Why are these plants smaller over here?” (response variable is observed plant heights)
“Why are there more fish in my net today than last month?” (response variable is observed fish abundance)
“Why does the hormone level in the blood differ from one individual to another?” (response variable is hormone level)
These questions are called “research questions” and they identify your response variable (contrast this with your research hypothesis in an upcoming section).
Note that your research question is always asking “why” - why something is varying. That something is your response variable (so your response variable should be something observable and varying).
Motivating your response
Though it is not necessary to be able to proceed with statistical modelling, it is useful at this point to stop and think about your scientific motivation for wanting to explain the variation in your response.2 Why is it important to explain different tree heights? Or fish abundance? Or hormone level? Being clear about what variation you are trying to explain (your response variable) and your motivation behind wanting to explain it will make up a good portion of your introduction section to a report or paper - and help shape your discussion section as well.
Describing your (expected) response variability
Even before you have collected your response data, you can begin to describe how you expect your response to vary. This will allow you to start planning how you will form and test your hypothesis, find potential errors in your response data, and best communicate your study to others.
What is the nature of your response?
The first step is describing the nature of your response variable. This will allow you to choose a data distribution (mathematical representation) to define the types of values you expect your response variable to be.
To describe the nature of your response variable, you will communicate whether your response variable is numeric or categorical, and if numeric, what values you expect it to take (e.g. can your response be negative? can it be zero? can it include a decimal?)
Here is a chart to help you describe the nature of your response distribution:

And here is a link to a chapter on Data Distributions. More on this soon.
Exploring your response variable
Once you have your data, you should explore the range and any missing values. Here are some tools for working with missing values
Does everything meet your expectations? Are you missing data?
This is also a good time to plot your data, e.g. with a histogram.
Footnotes
Notice I write “Response(s)” in the title of this section - plural. It is possible to have multiple response variables and we will discuss this elsewhere in the handbook when we discuss multivariate data. For the focus of this handbook though, we will begin by working with one response variable↩︎
To expand on this idea, research questions should follow the FINER criteria: your research question should be Feasible, Interesting, Novel, Ethical, and Relevant @HulleyEtAl2007↩︎